Project Views
As projects are time-sensitive, we need different kind of views to convey information in a visual manner to users viewing them.
Apart from the generic list and report views for projects and tasks, OneOfficeERP also provides Gantt, Kanban, and Calendar views for tasks. You can access these views by going to the Task list and selecting them via the left sidebar.
1. Gantt Chart
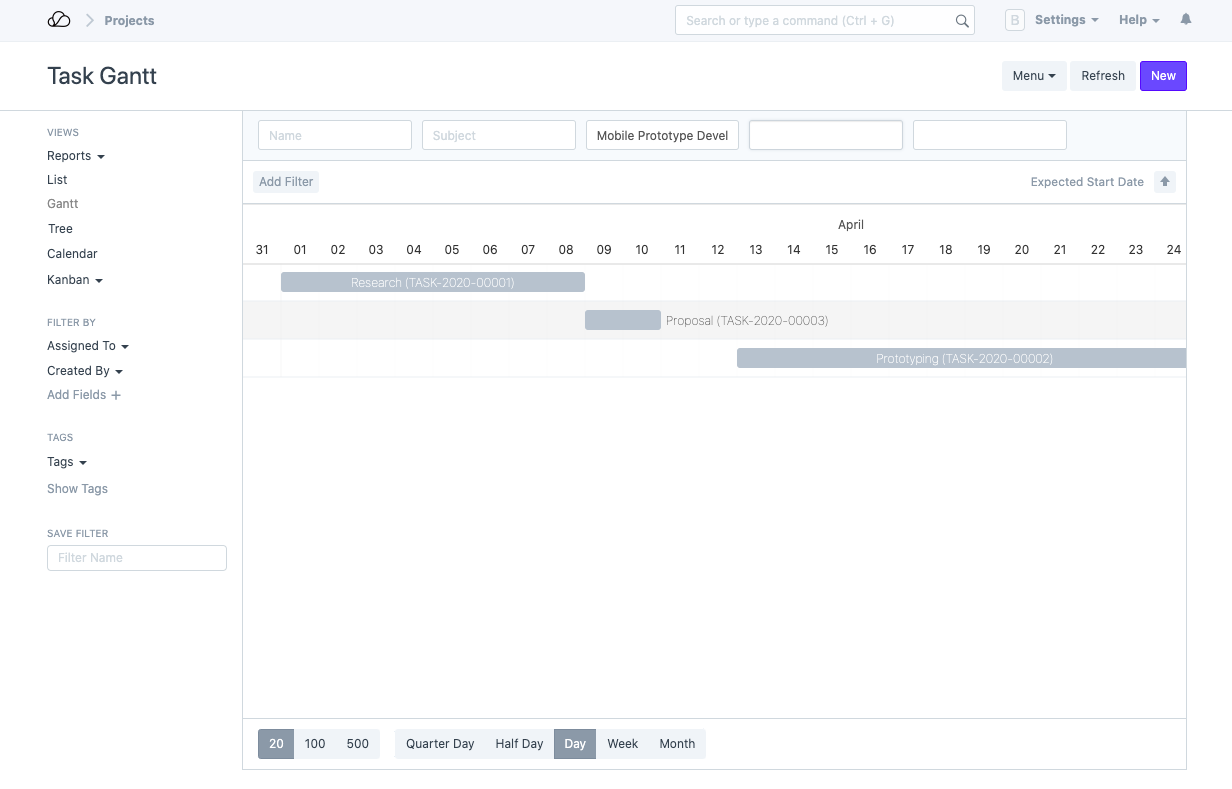
A Gantt Chart shows how tasks are linked to each other and shows their execution sequence, based on start and end dates set in the tasks along with any dependencies, if available.
 Gantt Chart for Tasks
You can update the range of the chart by selecting one of Quarter Day, Half Day, Day, Week, or Month.
Dragging a task along the dates will update the start and end date of a task.
If you want to further customize the chart and make it more colorful, read this article
2. Kanban View
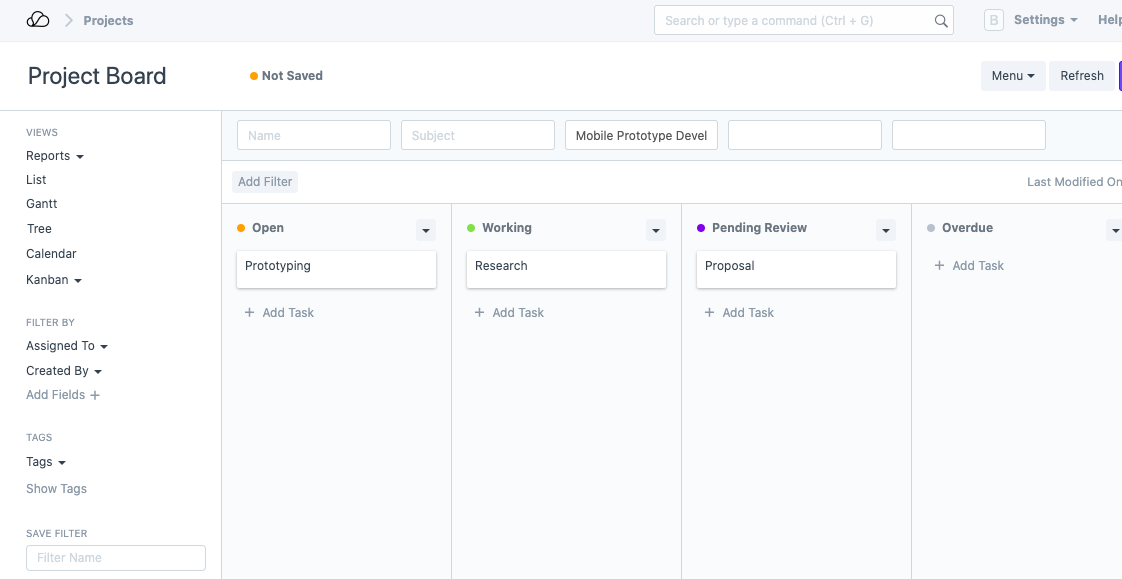
Kanban in Japanese means "billboard" or "signboard" as the task management method traces its origin back to Toyota's lean manufacturing process. In a typical kanban board setup, you have a board or wall which is divided into section which represent different stages of execution or realization. Tasks go up on the board as sticky notes or Post Its and move through the board updating its current stage in the process.
 OneOfficeERP Kanban Board
OneOfficeERP renders the Kanban view for tasks based on its status. You can update the status of a task by moving the representative card from one column to the next. You can also assign colors to these columns for visual reference.
Read customizing Kanban board to learn more.
3. Calendar View
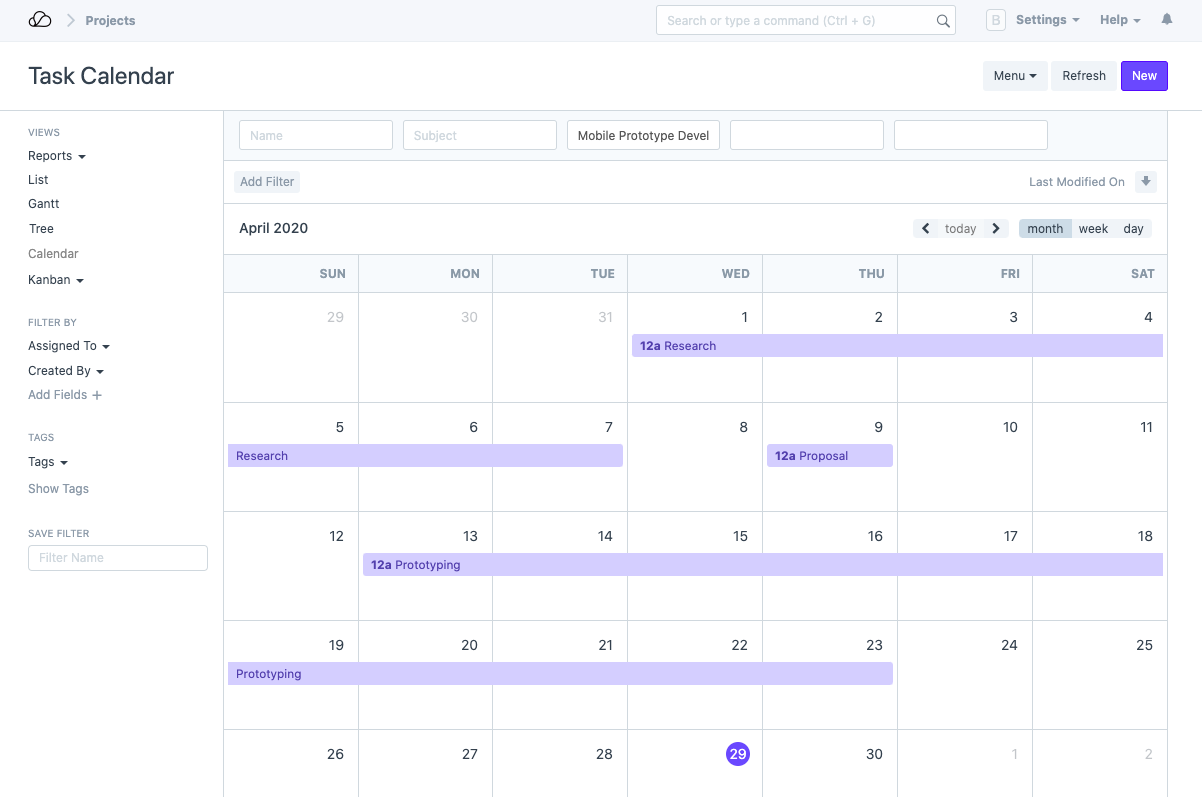
Like the Gantt chart, the calendar view also shows the task and the planned number of days it'll take to complete. However, this one shows the task spread across your regular calendar.
 Calendar View for Tasks